Bitcoin trading volume stays low, but price is still inching higher.
Daily RSI not very high
Margin trading funding levels at high levels, with some spectactular long and short liquidations seen throughout the weekend.
Very little resistance above the 60.000 level!
Looking at two different patterns which both point to a possible bullish move upwards, either a wedge, or a triangle.
Looking for confirmed continuation on Bitcoin breaking up from triangle. Daily close above 61.000 would be great, especially if it comes at decent trading volume.
Bearish thesis still being put forward remains that the lack of volume indicates buying interest is not high enough to take Bitcoin further.
The company has developed a new autofocus lens which “replicates” the human eye for use in mobile devices and other applications with integrated cameras.
Amid red hot retail investor attention, the company has recently reported promising interest and developments for its products
Euronext Growth has been a hotbed for European Growth stocks since Euronext finished the aquisition of Oslo Stock Exchange, with a flurry of highly successfull IPOs
BullionVault.com is one of the best providers for investing in Precious Metals online.
poLIGHT Weekly Chart
Market cap: 2,18 billion NOK (0,26 billion USD)
We asked for autofocus in selfiecam with the speed of the human eye 🤥 … why did you mentioned when something in the future ?? Polight’s TLens in the #OnePlus9Pro and mission would have been completed 🌛
Jeg har valgt at gå ind i polight noteret på den norske børs. Polight brød i fredags op gennem kurs 100 efter flere forsøg og lukkede i 100,6. Meget spændende virksomheder, som stadig er en udviklingsvirksomhed. De præsenterer Q4 næste uge.
Our CTO @n3ocortex spoke with @stephanlivera about #Bitcoin on-chain indicators, the liquidity squeeze, exchange reserves, institutional demand, HODLer behaviour, and much more!
Adding to the Sotkamo Silver position based on momentum indicators getting pretty low after a solid selloff
(Please drop me a message if any numbers in the spreadsheet are wrong! 🙂 )
Support this page and get signon bonuses
If you find this page useful, why not head over to the Support section and see my affiliate codes for services I personally use, which can give a mutual bonus.
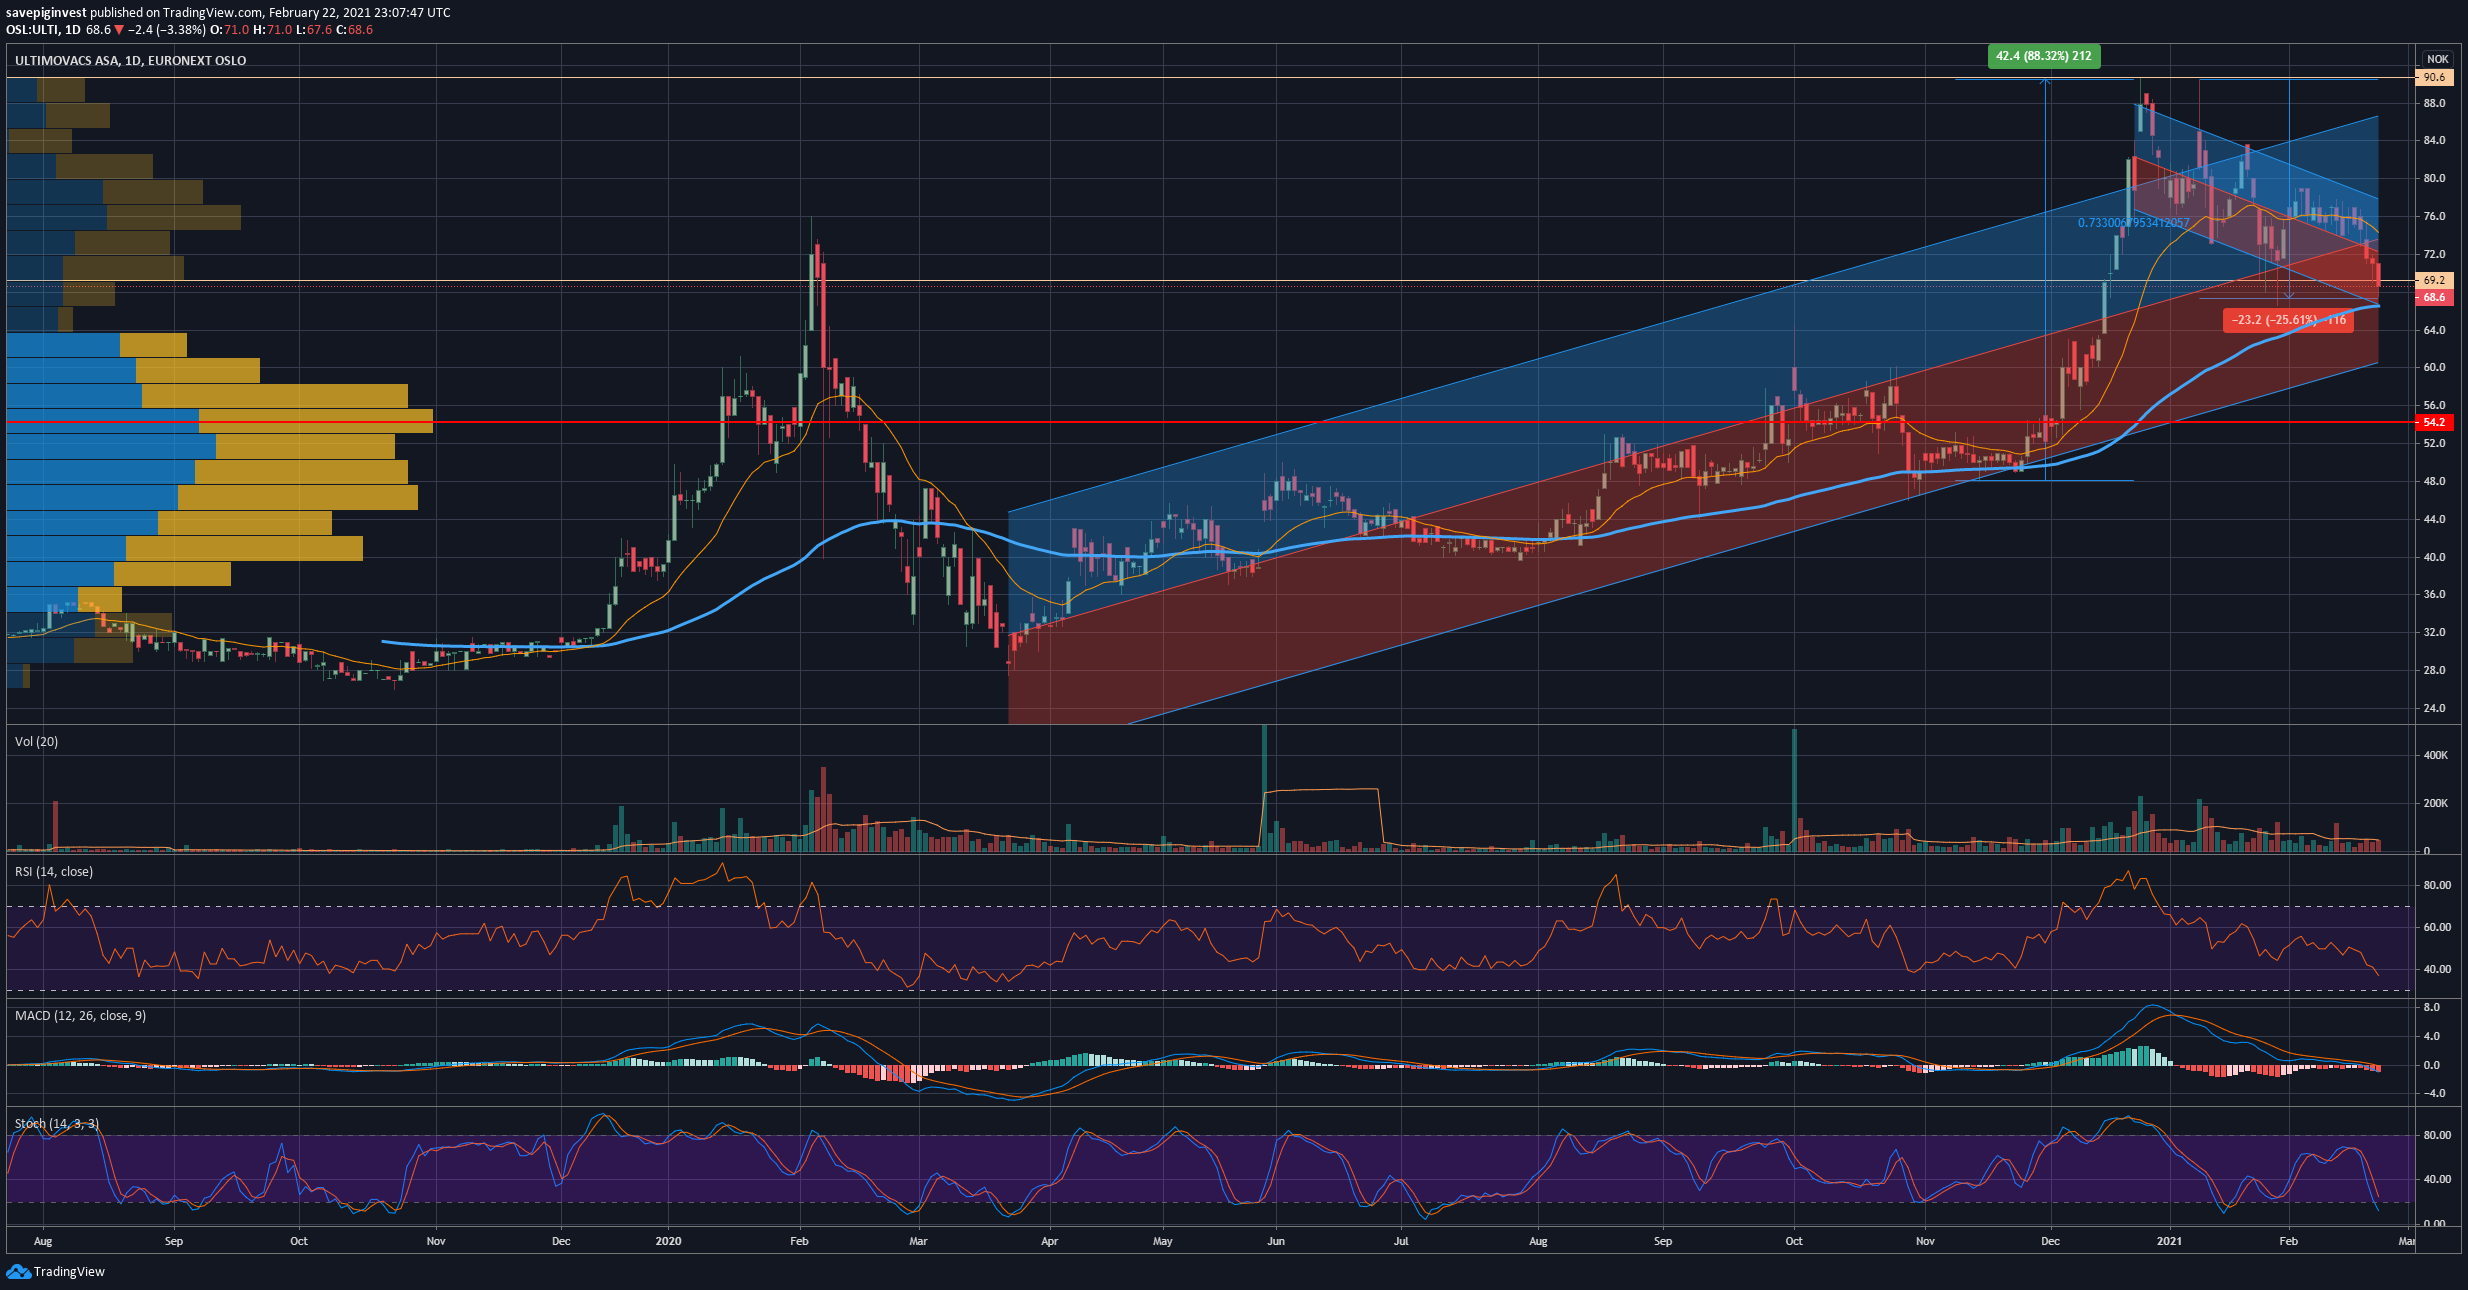
Ultimovacs rallied strongly on news about continually adding new clinical trials for its cancer vaccine technology, firmly capturing the spotlight as the norwegian biotech stock that could demonstrate best momentum in clinical trials during the difficult 2020 year.
Since hitting ATH the stock has pulled back about 22%, and the momentum indicators are well cooled off.
Ton Berkien, CBO in Ultimovacs, has the last 15 years worked with business development and acquisitions in the pharmaceutical industry. Interview in E24 about these topics: https://t.co/unw6Oe3XZD
Article in @HealthTalkNorge featuring Ultimovacs' CMO Jens Bjørheim discussing the DOVACC trial, ovarian cancer and Ultimovacs' development program: https://t.co/4xp4Si4ads
$ULTIMO Despite the pandemic @ultimovacs has delivered on its promise to initiate a third Phase II trial (UV1 durvalumab & olaparib in ovarian cancer) led by investigators, with combination drugs supplied by @AstraZenecaUS
Sotkamo Silver AB is a young mining company located in Finland that just reported on their 5th full quarter of full production.
Investors in Sotkamo have had to endure quite some volatility in the stock in recent weeks with the #SilverSqueeze and #WallStreetSilver focus playing heavily into the share price of the company.
On February 17th the company reported on Q4 numbers, and the share price fell as much as 30% intraday top-bottom from the day before! Year end report download
On first looks, numbers from Q4 did not look good, with sales down to 78 million swedish crowns (SEK) compared to 130 million in Q3, and silver production of 349 thousand ounces, down from 433 thousand in Q3. Q3 report download
However, when looking into the report, the company does give an explanation on the subject, and refers investors to zoom out and focus on longer timed averages.
“We have been preparing the mine production in the deeper levels of the mine by drifting horizontal tunnels to follow the ore zones. This had an impact to mill head grades which were lower than in average in October and November but recovered in December to average level.
Silver production of the reporting period was ca. 350 kilo-ounces. This sets to the low end of the range of 350-430 kilo-ounces which has been the variation during the last six quarters, i.e., ca. 390 kilo-ounces +/- 10% per quarter. Volatility of the head grades is high in a short period but evens well in quarterly or yearly period. Silver production of 1.58 million ounces is well within the production guidance for the full year which was 1.4 to 1.7 million ounces.
Lower metal production compared to the previous quarter and Q4/2019 and final price determination mechanism had an impact to our revenue which was 78 MSEK for the reporting period and totalled to 366 MSEK for the full year. Volatility of the production and especially the final pricing mechanism have strong impact to the revenue and financials of a single quarter while annual figures illustrate much better the performance of the company. “
“Preparations for the mine production in the deeper levels of the mine by drifting horizontal tunnels to follow the ore zones had an impact to mill head grades which were lower than in average in October and November but recovered in December to average level. In addition, the ore has natural variance in the grades “
From 2020 report
Q1 2021 numbers will be presented in only two months. I am not skilled in mining investments at all, but for my portfolio I will be holding the Sotkamo Silver stock and see if numbers does indeed even out in this quarter.
The quoted spot price for silver in the market seems very low compared to what is possible to find at silver retailers at the moment. Typically you will be paying a heavy premium on any silver product you can get your hand on.
Note a small increase in number of shares registered, from 179,977,732 to 184,518,783 due to a convertible.
(Please drop me a message if any numbers in the spreadsheet are wrong! 🙂 )
Daily chart 2018 – 2021 with Silver Price comparison added.
Note that Sotkamo share price is lagging quite heavily compared to silver price.
A nice and sustained uptrend has been established for Sotkamo since march 2020, with some crazy price movements recently.
15 minute chart of recent weeks
Normally 15 minutes charts are only usable for daytraders, but it is worthwhile having a look at investor behaviour and at which levels we have seen crazy gap movemements to the upside and to the downside, as they may come into play later during february and march.
Nordic Nanovector experienced the perfect storm in 2020 when their clinical trials were hit by the Covid19 pandemic, at a time the companys finances very already getting quite bad.
On the Q4 2020 presentation, the company could finally report a clear uptick in patient recruitment to the PARADIGME pivotal study, as well as a high likelyhood of reduced requirements from 130 to 120 patients.
This means that the company is still guiding a 2021 readout of the trial, with subsequent filing for accelerated approval.
Investors reacted very favourable to the news, sending Nordic Nanovector stock up +46,84%
Nordic Nanovector Sees Significant Improvement in Patient Recruitment Rate in PARADIGME, its Single-arm Phase 2 Pivotal Trial with Betalutin® in R/R Follicular Lymphoma https://t.co/49Re6e6Mwb
Nordic Nanovector completes enrolment into second safety cohort of follicular lymphoma patients in Archer-1 Phase 1b Betalutin®/rituximab combination trial https://t.co/tSFUG51US0
Following Bitcoin punching through 50.000 and 52.000 in a very short time, ETH found new energy and has broken up from a triangle pattern.
A new test of the 1880 level seems almost deterministic, but can ETH punch through and go straight to 2000?
Possibly the most bullish news is that BlackRock, the worlds largest asset manager at $8.7T in assets under management, says that they are starting to ‘dabble’ with #Bitcoin
If you find this page useful and are also interested in getting into cryptocurrency investments, you can use the following affiliate links to sign up for two good crypto services, and earn a bonus for me and yourself.